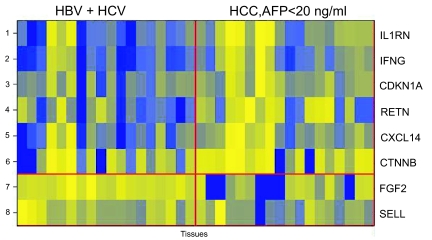
Figure 3. Heatmap for top scoring proteins that differentiate between HCC with AFP <20 ng/ml and hepatitis.
The yellow shade represents higher fluorescence signals for the protein and blue shade represents the lower signals for the proteins. IL1RN, IFNG, CDKN1A, RETN, CXCL14 and CTNNB show up-regulation in HCC group with normal AFP level (<20 ng/ml). FGF2 and SELL show down-regulation in HCC group with normal AFP level (<20 ng/ml).

