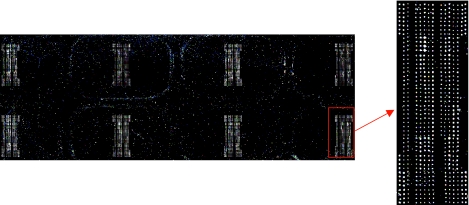
Figure S1. Agilent 8-pack antibody array.
A scanned fluorescent image of 8 protein arrays on one slide is shown; one array is enlarged to show detail. On a typical array, background signals in between the antibody features ranged from 30–60 fluorescent units, while the signals on the antibody features ranged from 200–400000.

