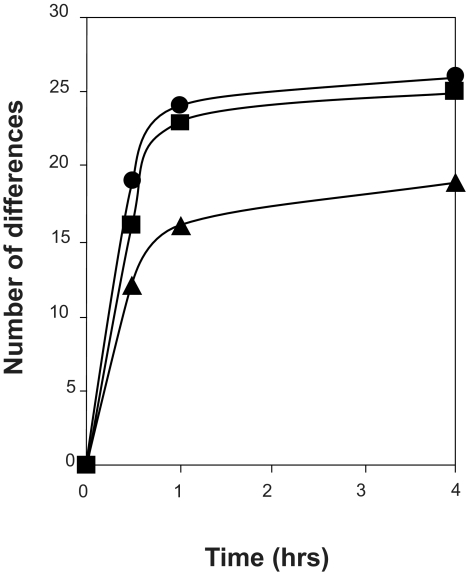
Figure 4.
Number of significant differences in peak intensity between the different conditions (• control, + azide and ▴ protease inhibitors) and the different time points compared to 0 hrs. Differences were calculated from the spectra (Fig. 3) for the mass ranges of 1000 to 20000 Da using cluster analyses of triplicate measurements of the samples. Clusters were defined using S/N > 5 (first pass) and S/N > 2 (second pass). Differences were considered significant if p < 0.05.

