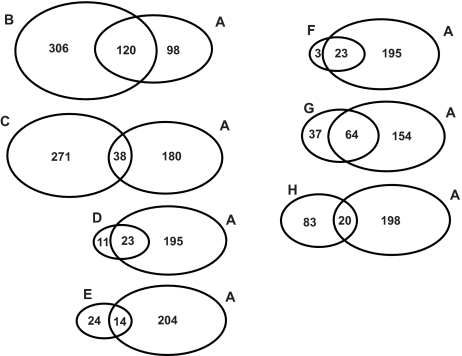
Figure 7.
Venn diagrams comparing the proteome results obtained with this study (A) versus those achieved by Xie et al. (Xie, 2005) (B), Hu et al. (Hu, 2005) (C), Vitorino et al. (Vitorino, 2004) (D), Walz et al. (Walz, 2006) (E), Huang et al. (Huang, 2004) (F), Wilmarth et al. (Wilmarth, 2004) (G), Guo et al. (Guo, 2006) (H). Only part of the data of the study by Guo et al. is publicly available and was used in this comparison.

