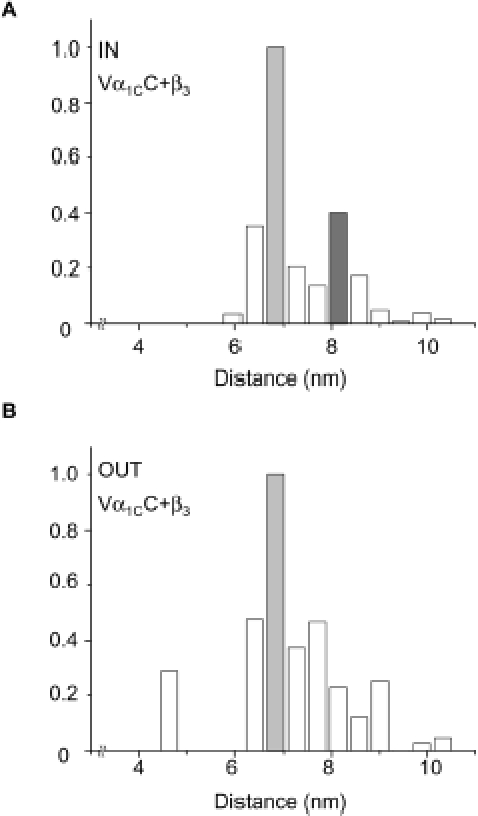
Figure 2. Intramolecular vs. intermolecular FRET in Vα1CC revealed in TIRF images.

Vα1CC, α2δ and β3 were co-expressed in COS1 cells. Two-color FRET was measured in TIRF images and converted into distances r between V and C as described in Methods. Shown are normalized cumulative histograms (n = 11) for r calculated for ROI inside clusters (A, total number of pixels m = 231) and outside clusters (B, m = 3908) identified by wavelet transform. The same intramolecular (r V-C) distance ≈6.8 nm (light gray bars) was observed both inside and outside clusters, while intermolecular (r V∼C) distance ≈8.1 nm was observed only in clusters (dark gray).
