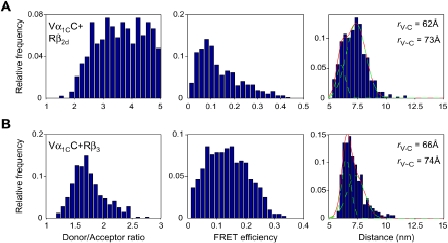
Figure 5. Intramolecular vs. intermolecular FRET in Vα1CC.

The Vα1CC subunit was co-expressed in COS1 cells with α2δ and Rβ2d (A) or Rβ3 (B). Shown are histograms of donor/acceptor ratio (left column), FRET efficiency (middle column) and distance (right column) determined in the plasma membrane region of two representative COS1 cells. The red solid line is the best fit to a sum of two Gaussian distributions with indicated means (green dotted lines) for intramolecular (r C-V) and intermolecular FRET (r C∼V).
