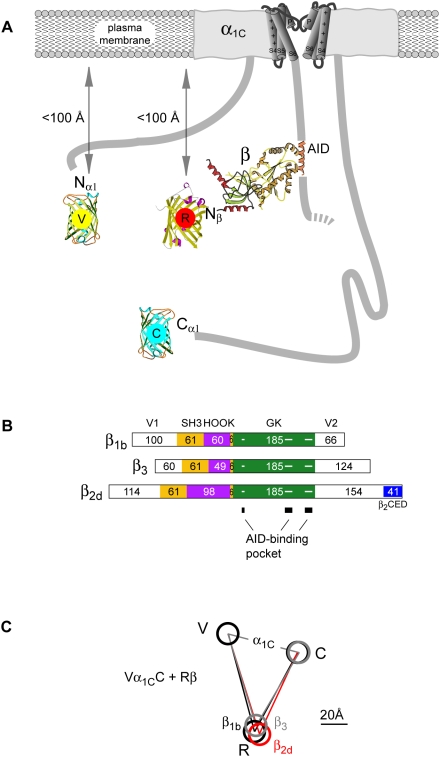
Figure 6. Molecular distances between the N- and C-termini of α1C and the Cavβ-subunit N-tail of β1b, β2d and β3.
(A) Schematic representation of Vα1CC with Rβ arranged under a vertically sliced α1C. The structures of TagRFP and Cavβ core MAGUK region were drawn based on PDB codes 1uisA [37] and 1t0j [62], respectively. FRET measurements with ECFP-labeled plekstrin homology domain in the inner leaflet of the plasma membrane [40], [63] showed that the N terminal tags of both the α1C and Cavβ subunits are located within the 2× Förster distance (<100 Å for ECFP/EYFP) from the plasma membrane. (B) Schematic representation of the domain organization of β1b, β2d and β3 aligned in regard to AID-binding guanylate kinase (GK) domain (green). Yellow box indicates the Src homology 3 (SH3) domain, purple the variable HOOK region, and blue the β2CED [44]. Number of amino acids is shown inside boxes. Amino acids involved in AID-binding pocket are marked in GK by three horizontal lines (for details see [62], [64], [65]). (C) Schematic representation of the results of simultaneous measurements of the molecular distances between three fluorophores shown in panel (A) in Vα1CC/α2δ/Rβ in the presence of Rβ1b (black lines), Rβ3 (gray lines) and Rβ2d (red lines).

