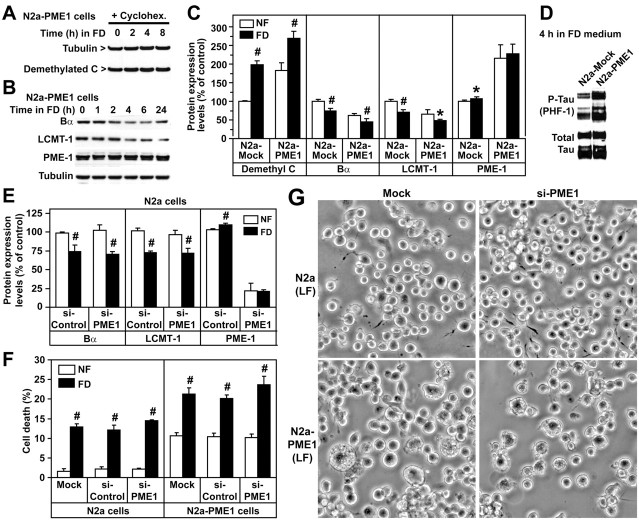
Figure 4.
Effects of PME-1 overexpression and knockdown in N2a cells cultured in NF and FD medium. A, Compared with control N2a cells (Fig. 1B), demethylated C levels remain constant in N2a–PME-1 cells after pretreatment with cycloheximide and incubation in FD medium. B, Western blot analysis of total cell extracts from N2a–PME-1 cells incubated for 0–24 h in FD medium. Note that myc-tagged PME-1 migrated slower than endogenous PME-1. C, Demethylated C, Bα, LCMT-1, and PME-1 expression levels were compared in N2a mock-transfected and N2a–PME-1 cells 4 h after incubation in NF or FD medium (mean ± SD; n = 5; FD vs NF, #p < 0.001, *p < 0.05). D, Representative immunoblot showing that overexpressed PME-1 further enhances tau phosphorylation induced by incubation of cells for 4 h in FD medium. E, Relative expression levels of Bα, LCMT-1, and PME-1 in N2a cells transfected with siRNA targeted for PME-1 (si-PME1) or control siRNA (si-Control), 4 h after incubation in NF or FD medium (mean ± SD; n = 5; FD vs NF, #p < 0.001). F, Effects of PME-1 overexpression or knockdown on cell death 24 h after incubation in NF or FD medium (mean ± SD; n = 4; FD vs NF, #p < 0.001). G, Representative images illustrating the effects of PME-1 overexpression and knockdown on cell morphology 48 h after incubation of cells in LF medium containing 0.1% FBS.

