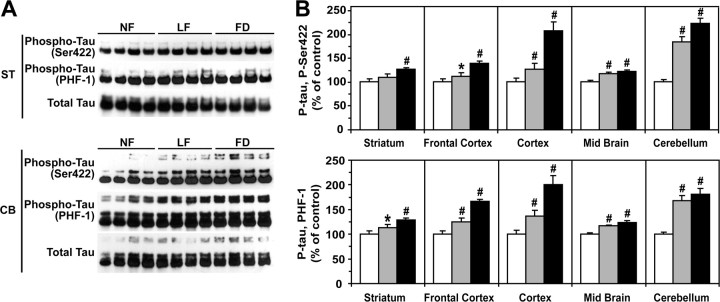
Figure 7.
Brain-region-specific effects of dietary folate deficiency on tau phosphorylation. A, B, The same mouse brain homogenates described in Figure 6 were analyzed for tau phosphorylated at the Ser422 and PHF-1 epitopes after normalization for total tau levels. A, Representative immunoblots for the striatum (ST) and cerebellum (CB). B, Relative phosphorylated tau expression levels in each brain region. Data are mean ± SD; n = 6 mice per group; #p < 0.001; *p < 0.05.

