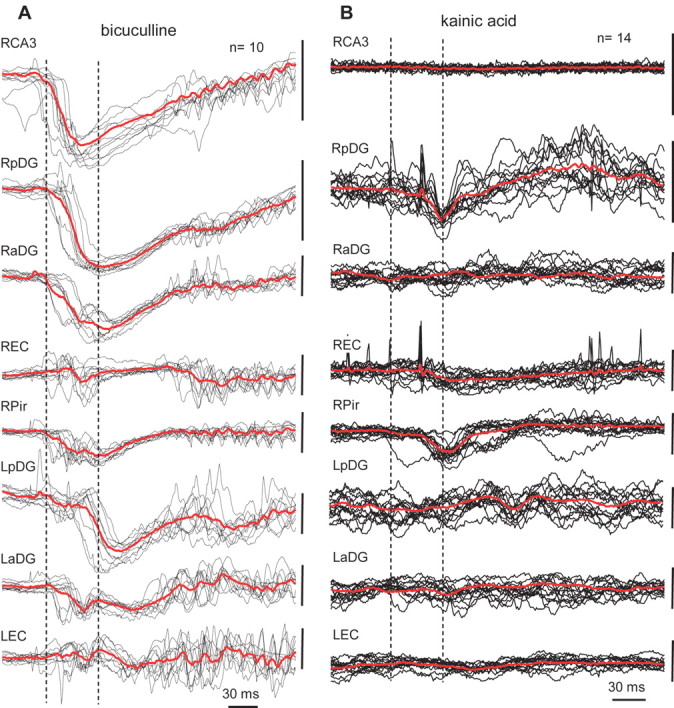
Figure 4.

A, Examples of epileptiform events recorded in different brain areas during the electrographic phase of a seizure evoked by bicuculline injection. Events were collected and superimposed within a period of 20 s before the clinical phase of the seizure using the peak of the event generated in the right dentate gyrus as a zero point. Red lines represent average of these potentials. Dashed lines outline a 40 ms window when all events reach the maximum of amplitude. B, Examples of 14 epileptiform events from the same recording sites within a period of 20 s before the clinical phase of a seizure evoked by kainic acid injection. See schematic of electrode montage in Figure 1. The calibration bar on the right of each line is 1.0 mV.
