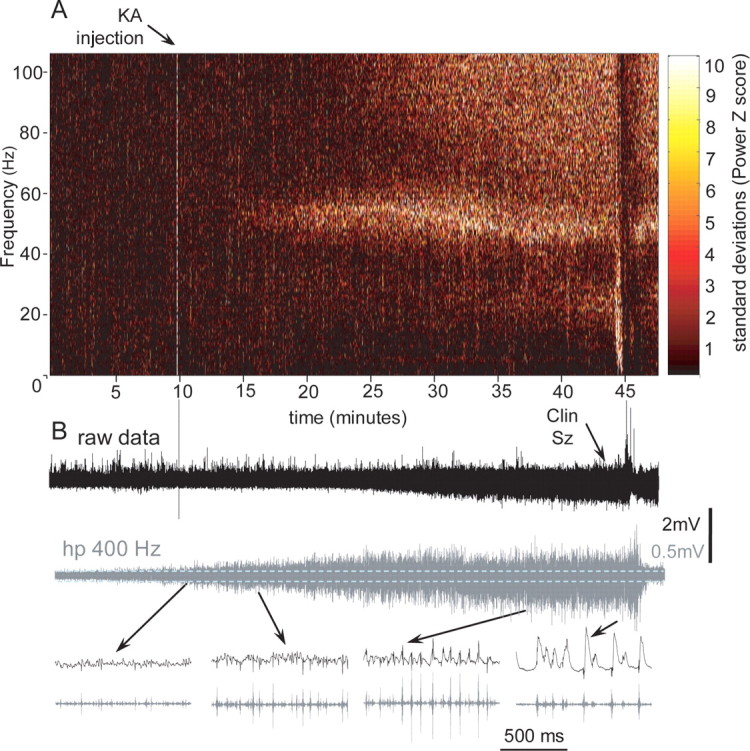
Figure 8.

Development of a seizure after kainic acid injection. A, Color-coded power spectral maps calculated with a Fast Fourier Transform using a sliding window of 10 s with 1 s overlap. The change in the color is coded in SDs with the scale on the right side of the plot. The hot color indicates an increase in the power of specific frequency bands. B, Increase in amplitude during the transition period on the records of raw data (0.1 Hz–3 kHz) and multiunit activity (hp 400 Hz). Below, Extended fragments of records from different times during the transition period.
