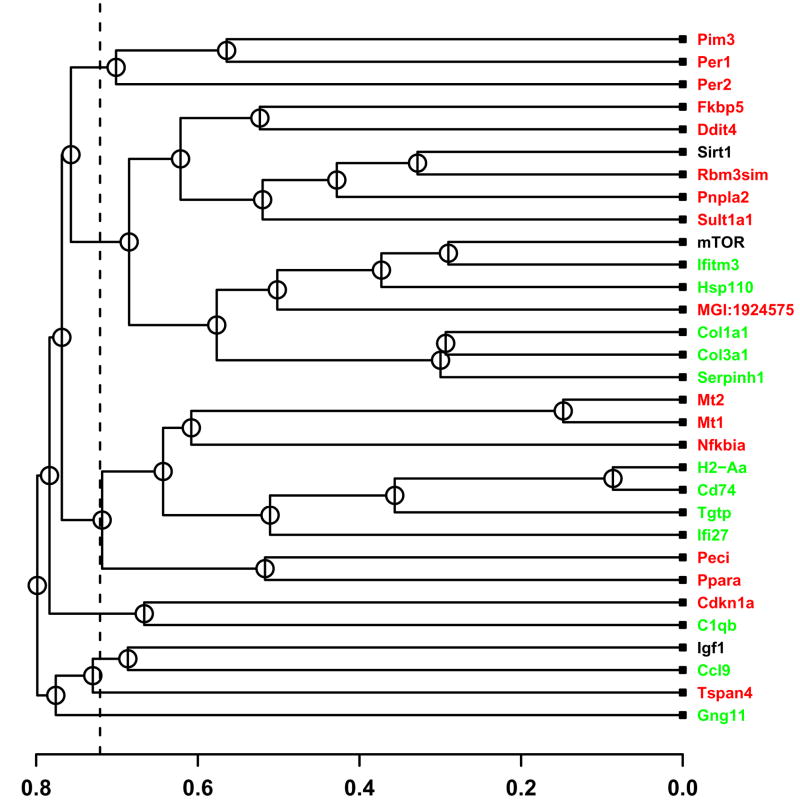
Figure 1.
Co-expression relationships among CR-regulated genes. The 28 CR-regulated genes were clustered with respect to expression pattern similarity. Labels of genes downregulated by CR are displayed in green, while labels of genes upregulated by CR are displayed in red. The horizontal axis indicates the average distance at which two clusters (or individual genes) were joined. A distance matrix was computed with respect to each of four independent datasets (Tissue, Developmental, Treatment and Mutation series), where distance between expression profiles was based upon absolute value of the Pearson correlation coefficient. A final distance matrix was generated by averaging distance values across the four datasets, and average linkage hierarchical clustering was then used to generate the tree shown in the figure. The dashed vertical line provides indication of the lowest distance expected to arise by chance between any two genes (given that n = 31 genes are included in the tree). In particular, for 95% of 10,000 randomized simulation trials, with n = 31 genes sampled at random from the Affymetrix 430 2.0 array, the lowest distance was larger than the value represented by the vertical dashed line in Figure 1. Supplemental data file 2 shows clustering outcomes for the same genes based upon expression patterns in each of the four datasets individually.

