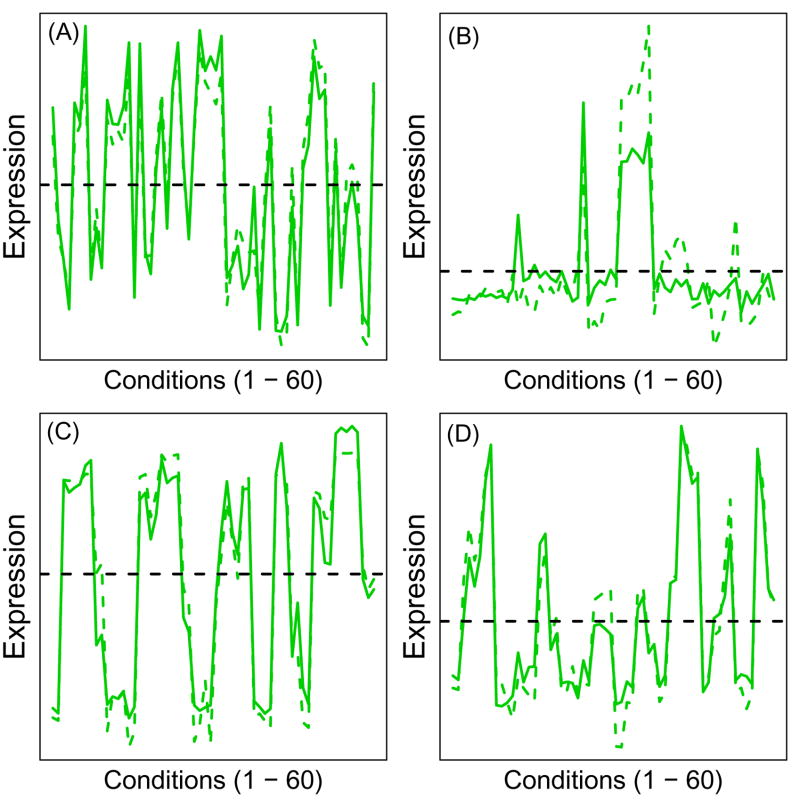
Figure 2.
Expression patterns of H2-Aa and Cd74. Plots show expression patterns across the (A) Tissue, (B) Developmental, (C) Treatment and (D) Mutation series. In each plot, the vertical axis represents expression level, with the 60 conditions in each dataset arranged along the horizontal axis. The solid green line represents the expression pattern of H2-Aa while the dotted green line corresponds to that of Cd74. Expression patterns of each gene were centered to have the same average expression across the 60 conditions in each dataset. This average expression level is represented by the dashed horizontal line in each plot.

