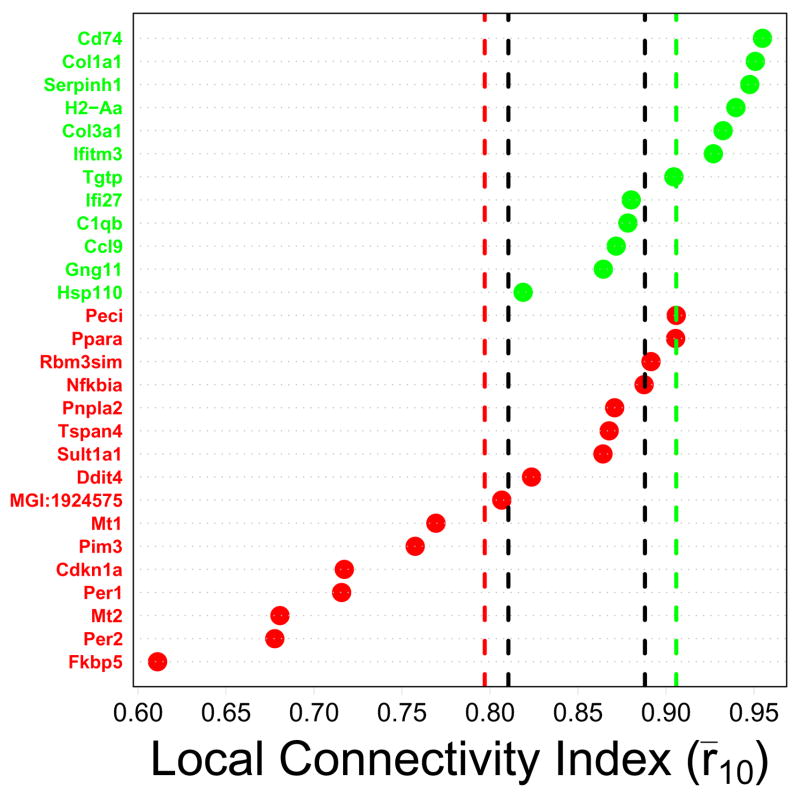
Figure 3.
Local connectivity index (Treatment series). CR-regulated genes are listed along the vertical axis, with green labels corresponding to CR-downregulated genes and red labels corresponding to CR-upregulated genes. The horizontal axis corresponds to the local connectivity index. This index was determined for each gene by first calculating correlations between that gene and all other transcripts on the Affymetrix Mouse Genome 430 2.0 array, and then averaging the largest ten of these correlations. A large index value is expected for genes located in dense regions of the transcriptional network. The green vertical line indicates the average local connectivity index among the n = 12 CR-downregulated genes, while the red vertical line indicates the average local connectivity index among the n = 16 CR-upregulated genes. Vertical black lines indicate a conservative 95% confidence interval for the average index among n genes sampled at random (based upon simulation). The interval is conservative because it corresponds to {min(L1, L2), max(U1, U2)}, where random samples of size n = 12 yielded an average index in the range of {L1, U1} in 95% of trials, and random samples of size n = 16 yielded an average index in the range of {L2, U2} in 95% of trials. Results shown in the figure were generated from the Treatment series, but similar results were obtained based on the Tissue, Developmental and Mutation series (see Supplemental Data File 4).

