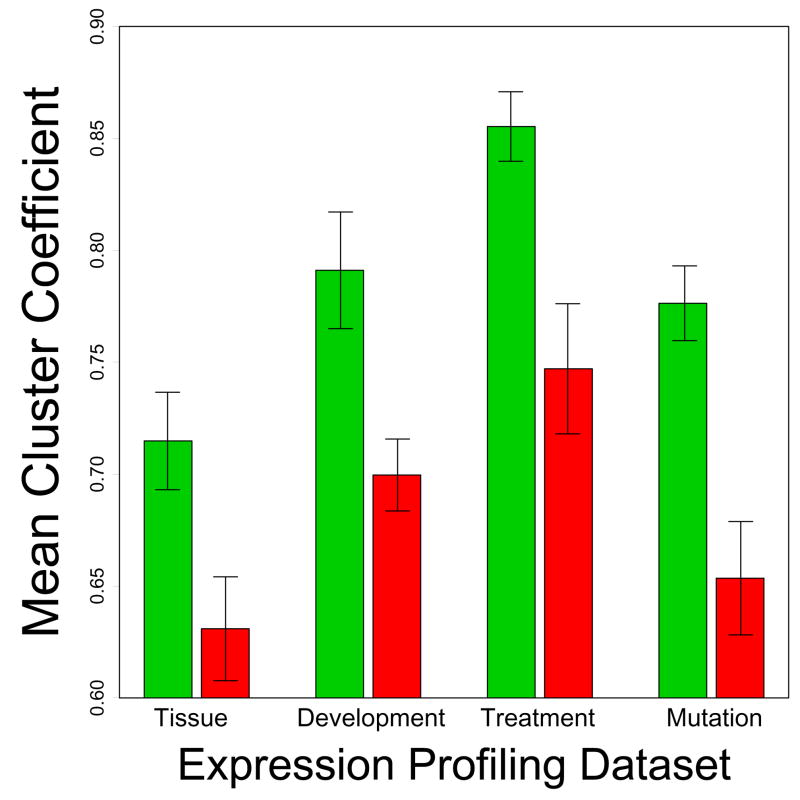
Figure 5.
Clustering coefficient. Green bars represent average clustering coefficients for CR-downregulated genes, while red bars represent average clustering coefficients for CR-upregulated genes. For each CR-regulated gene, the 20 genome-wide nearest neighbor transcripts were identified, and the clustering coefficient associated with each CR-regulated gene was calculated. The cluster coefficient ranges from 0 to 1 and measures the local density of expression networks surrounding a given node (transcript) (see Equation 5 from Dong and Horvath (2007)). Values near 0 indicate weak connectivity among neighbors at an individual node, while values near 1 indicate strong connectivity among neighbors at an individual node. Nearly identical results were obtained using the “line density” measure of local connectivity (see Equation 2 from Dong and Horvath (2007)).

