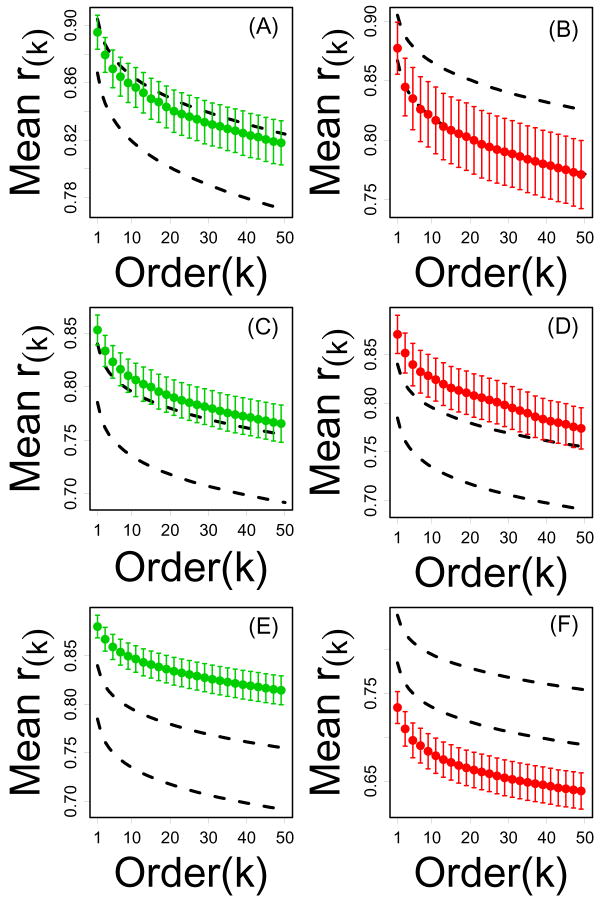
Figure 8.
Local connectivity of CR-regulated and dauer-regulated genes from invertebrate models. Parts (A) and (B) show mean correlation order statistics for Drosophila CR-downregulated and CR-upregulated genes, respectively. CR-regulated genes were chosen based upon microarray data from Pletcher et al. (2001). Parts (C) and (D) show mean correlation order statistics for CR-downregulated and CR-upregulated genes, respectively. CR-regulated genes were chosen based upon microarray data from Szewcyzk et al. (2006). Parts (E) and (F) show mean correlation order statistics for C. elegans nondauer-specific and dauer-specific, respectively. Dauer-regulated genes were chosen based upon microarray data from Jones et al. (2001) and Wang and Kim (2003). In each plot, the vertical axis represents the average kth correlation order statistic (among n transcripts) and the horizontal axis corresponds to k. Dashed black lines outline a 95% confidence region for the average kth correlation order statistic among n transcripts sampled at random (based upon simulation). Results shown are based upon the Drosophila and C. elegans series A datasets. Results based upon a second, independent dataset for each model (series B) are shown in Supplemental Data File 9.

