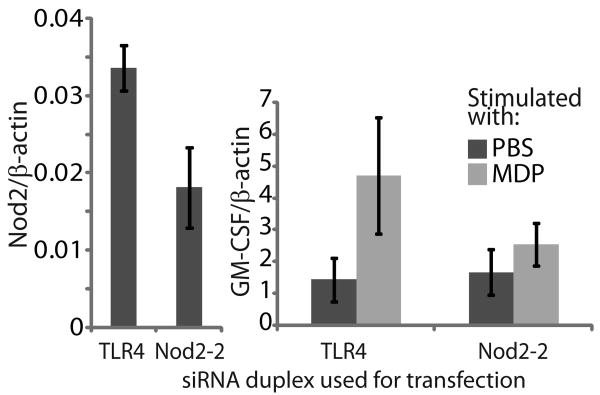
Figure 2.
Functional effect of Nod2 knockdown. Data from a representative experiment shows the Nod2 and GM-CSF transcript levels in live cells isolated after Nucleofector electroporation and stimulation with either PBS or MDP. When Nod2 was effectively knocked down (53.95 knock down) in enriched bovine γδ T cells, the change in GM-CSF transcript expression was decreased (average fold change after MDP stimulation of 3.5) compared to cells transfected with TLR4 (average fold change 5.7, p=0.0121).

