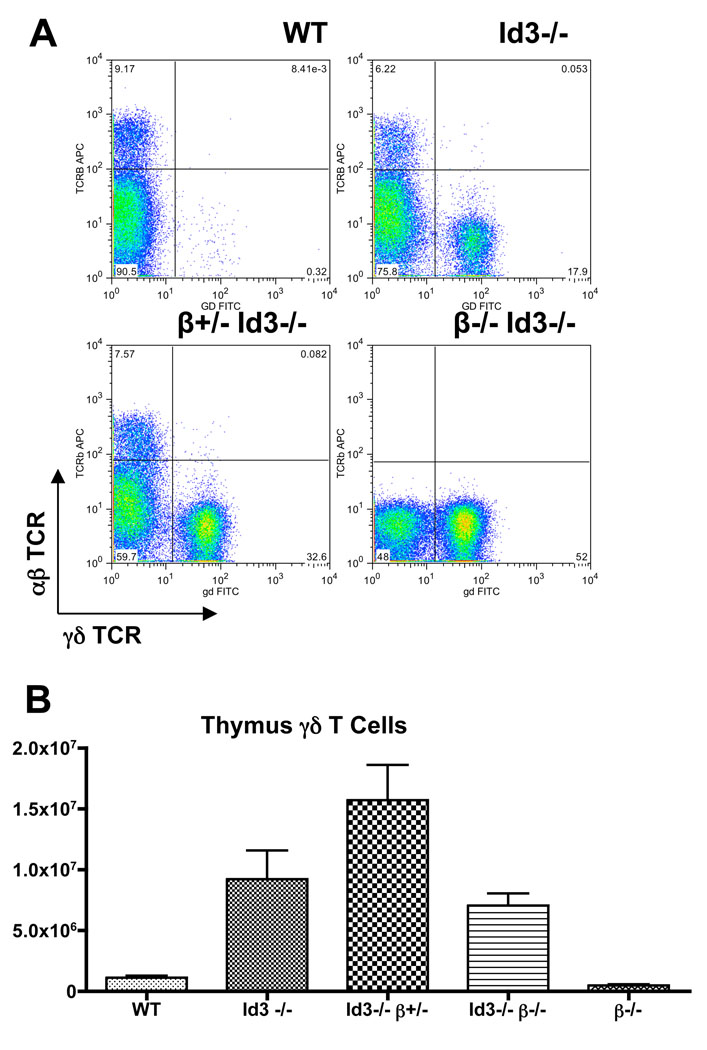
Figure 7. Additional enhancement of γδ T cell development by preventing the expression of a functional TCRβ chain.
A. Representative FACS plots showing the relative ratio of αβ vs. γδ T cells in the thymus of C57Bl/6 wild type control (n=13), Id3−/− mice (n=12), Id3−/−TCRβ+/− mice (n=5), Id3−/−TCRβ−/− mice (n−4), and TCRβ−/− mice (n=3).
B. Summary of absolute numbers of γδ T cells from thymus of each relevant genotype.

