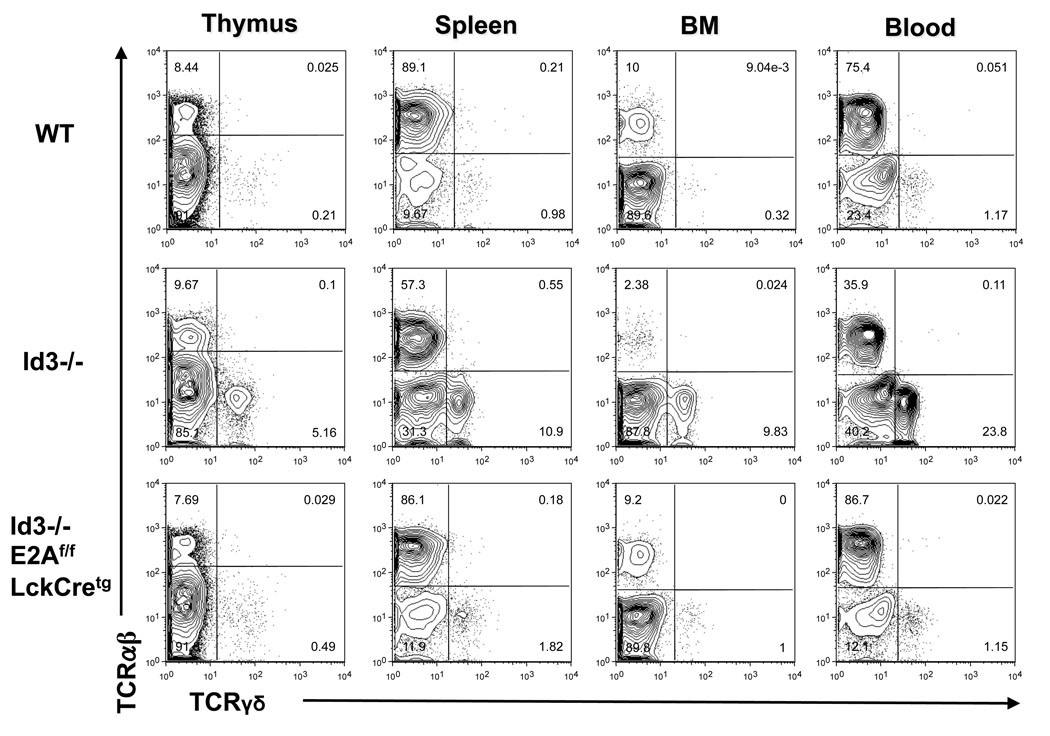
Figure 8. Analysis of γδ T cells from Id3−/− E2Aflox/flox LckCretg mice.
The relative ratio of αβ and γδ T cells in thymus, spleen, bone marrow, and blood of wild type, Id3−/−, and Id3−/−E2Aflox/flox LckCretg mice were analyzed by dual staining. Plots were gated on live lymphocytes excluding B cells. Results were representative of two independent groups of mice from the Id3−/− E2Aflox/flox LckCretg breeding.

