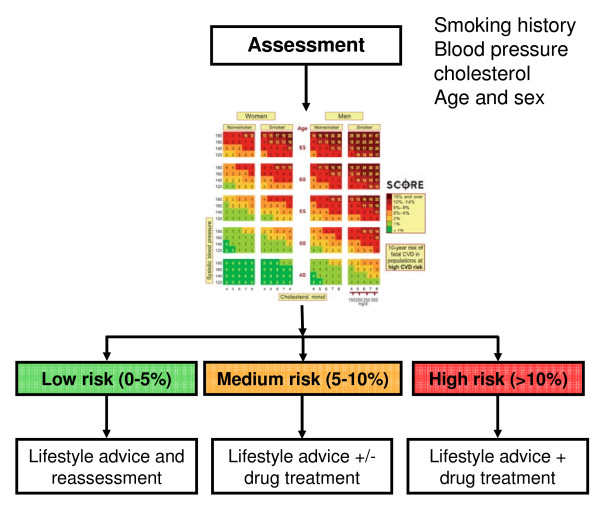
Figure 1.
Cardiovascular (CV) risk assessment and treatment choice; based on several parameters, patients fall into a specific colored box (details are illegible) and the color corresponds to a risk profile (green = low risk, orange = medium risk and red = high risk). According to that risk profile, treatment recommendation(s) are given.

