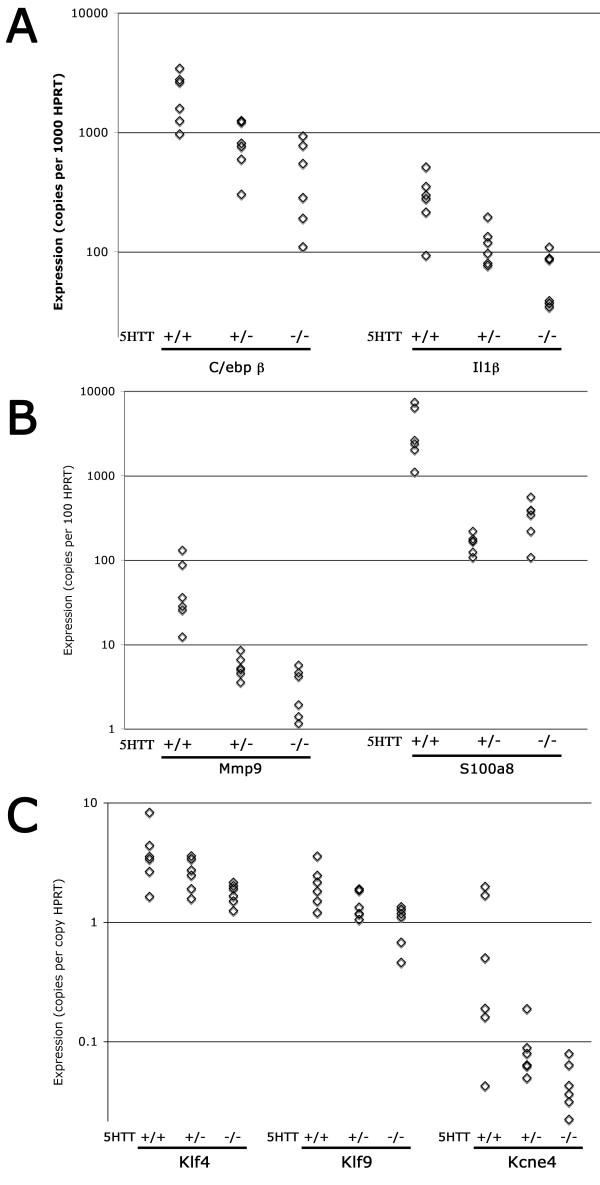
Figure 2.
Quantitative RT-PCR confirmation of array changes for selected genes. Each point corresponds to RNA from an individual mouse. All changes are significant by ANOVA as p < .01 except Klf4 and Kcne4 which are significant at p < .05. Expression in 5HTT-/- is significantly different than expression in 5HTT+/+ for all genes at p < .05 by Tukey's Post Hoc.

