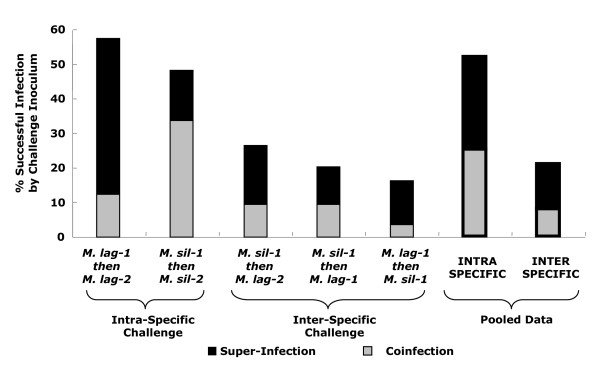
Figure 2.
Percent of plants per treatment expressing the challenger infection in at least one flower. Total numbers of diseased plants per treatment are given in Table 1, among which the pathogen genotype causing disease was determined. Percentage bars are split into two sections, with grey representing coinfections (both genotypes expressed), and black representing super-infections (only the challenger expressed). "M. sil" = Microbotryum silenes-inflatae, "M. lag" = Microbotryum lagerheimii. The two genotypes used from each species are designated "1" and "2" after the species abbreviation. The remaining percentages of plants on the y-axis were those where only the resident inoculum was the detected.

