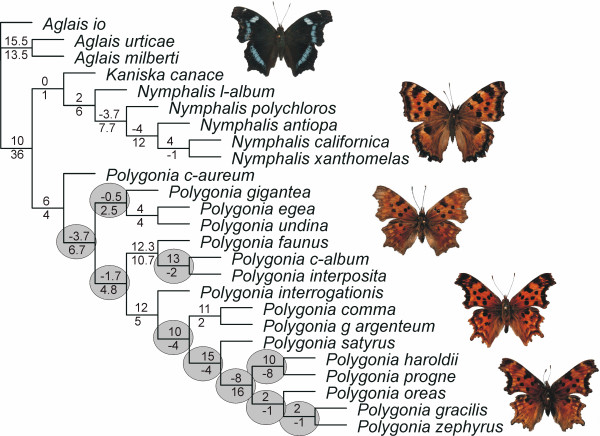
Figure 1.
Combined analysis of all genes. Values above branches are the Partitioned Bremer Support (PBS) values for the combined mitochondrial gene partition and values below branches are the PBS values for the combined nuclear gene partition. Grey circles highlight nodes with strong conflict within the Polygonia clade. Pictured butterflies are from top to bottom Kaniska canace, Nymphalis polychloros, Polygonia c-album, Polygonia satyrus and Polygonia zephyrus.

