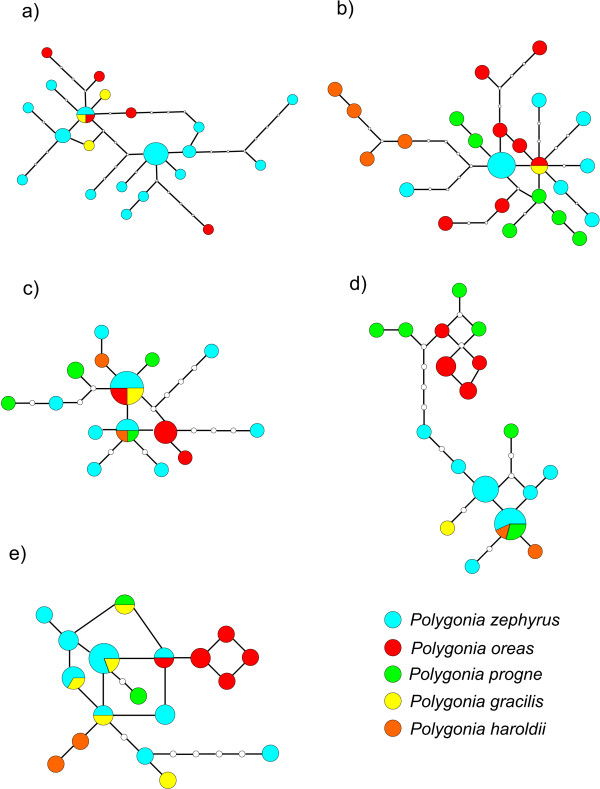
Figure 8.
Minimum spanning networks. a) COI b) EF-1α c) GAPDH d) RpS5 and e) wgl. Size of the circles are directly proportional to the number of individuals with that haplotype. Small white circles indicate a missing haplotype. Each branch is equivalent to one basepair change. Circles with more than one pattern show the proportion of each species. The colour coding are as follows; blue – P. zephyrus, red – P. oreas, green – P. progne, yellow – P. gracilis and orange – P. haroldii.

