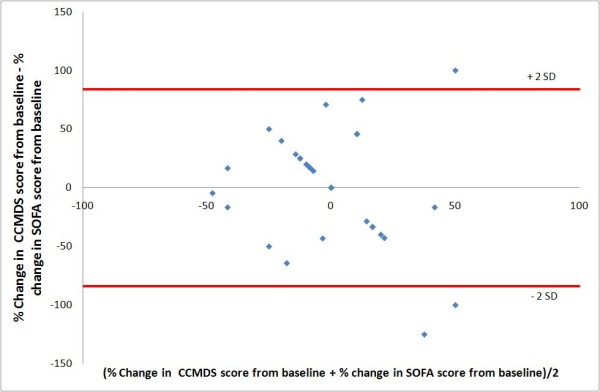
Figure 3.

Bland and Altman plot comparing the CCMDS-derived score and SOFA day 0 to day 1. Figure 3 shows a Bland and Altman plot comparing the difference in percentage change, from day 0 to day 1, in the CCMDS-derived score and SOFA score with the average of the CCMDS-derived score and SOFA score. the limits of agreement are indicated by the red lines.
