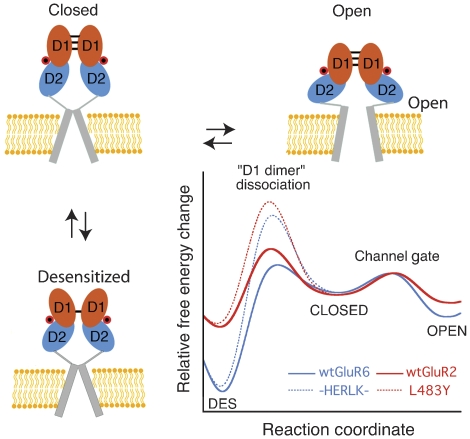
Figure 9.
Conserved model for kainate and AMPA receptor gating. State diagram showing how agonist binding energy is used to open the ion channel (activation) or to rearrange the dimer interface (desensitization). D1 and D2 of the LBD domain are shown in cyan and orange, respectively, whereas the transmembrane segments comprising the ion-pore are shown as a grey cylinder. Each subunit binds agonist (red circle) and undergoes transitions between agonist-bound closed, open, and desensitized states. Hypothetical plots are constructed for an AMPA and kainate receptor comparing the free-energy changes that occur during gating. Estimates for ΔGc->o, the ΔG of the closed to open transition, ΔGdes, the ΔG of desensitization, and ΔGdd, the activation energy barrier to rupture the D1 dimer, were estimated using −RT ln 1/kdeact, −RT ln kdes/krec, and −RT ln kdes, respectively. Approximate values for kdes, krec, and kdeact used for wt GluR2 are 126, 102, and 175 s−1, respectively, and kdes for L483Y is 6 s−1 (Sun et al, 2002; Horning and Mayer, 2004); for wt GluR6 and HERLK values used are as reported in Table I. Note that kdeact measured for L483Y is ∼4-fold faster than HERLK.

