Figure 2.
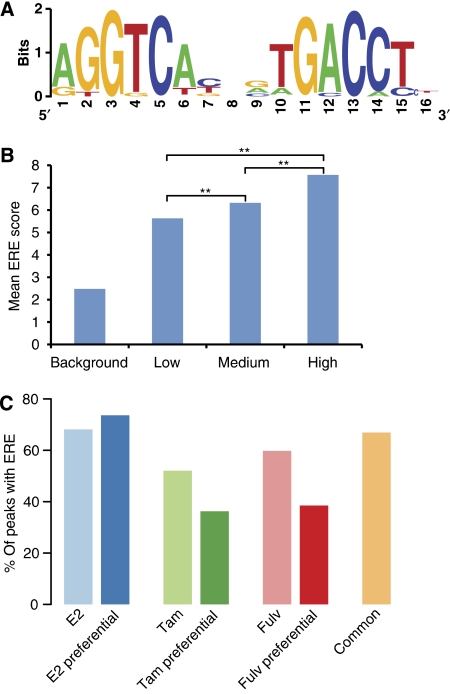
ERE motif and correlation with peak height. (A) The weight matrix of the highly overrepresented ERE motif. (B) Correlation of peak height with ERα motif score. The mean ERE motif score was determined using ERscan. ERα-interaction sites were binned according to peak height; random genomic regions were used as background. A clear positive correlation is obtained between the height of an ERα peak and the motif score. The mean of the motif scores in the three bins is significantly different as assessed by the Mann–Whitney test, with a P-value of <0.01, indicated by a double asterisk (C) Percentage of interaction sites containing an ERE. The different binding site profiles were searched for the presence of an ERE using ERscan. The ‘E2 preferential' group contains the highest percentage of ERE motifs as compared with the tamoxifen and fulvestrant preferential groups.

