Figure 8.
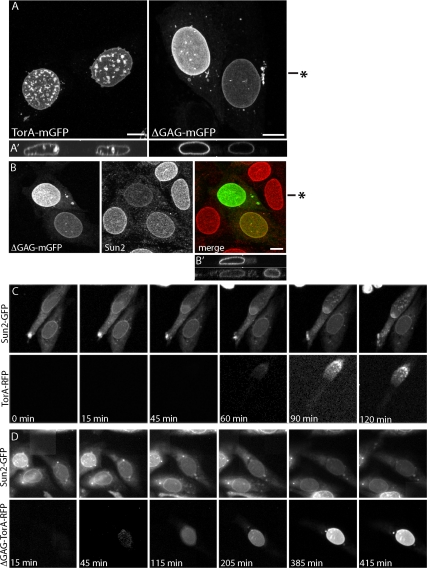
Comparison of wild-type and ΔGAG-TorA-mGFP effects on the NE. (A) Comparison of NE in cells expressing LULL1-myc (not shown) with redistributed wild-type TorA-mGFP (left) and ΔGAG-TorA-mGFP (right). NE membrane distortions occur in 68% of cells with NE-localized wild-type TorA (n = 136) and in 7% of cells with NE-localized ΔGAG-TorA (n = 74). Shown are maximum intensity projections of confocal z-series, with orthogonal xz views in A′. Approximate position of xz orthogonal slice marked by asterisk in A. (B) Effect of LULL1-redistributed ΔGAG-TorA-mGFP on Sun2. Projected z-series, with orthogonal views of ΔGAG-TorA (top) and Sun2 (bottom) in B′. Approximate position of xz slice is marked by asterisk in B. (C) Time-lapse imaging of Sun2-GFP and TorA-TagRFP in LULL1-myc–expressing cells. (D) Time-lapse imaging of Sun2-GFP and ΔGAG-TorA-TagRFP in LULL1-myc–expressing cells. The median delay between the onset of TorA-TagRFP redistribution and initiation of Sun2-GFP loss was <15 min (between consecutive frames) for wild type (±20 min, n = 32 cells) and 420 min for ΔGAG-TorA (±378 min, n = 33 cells). Scale bars, 10 μm.

