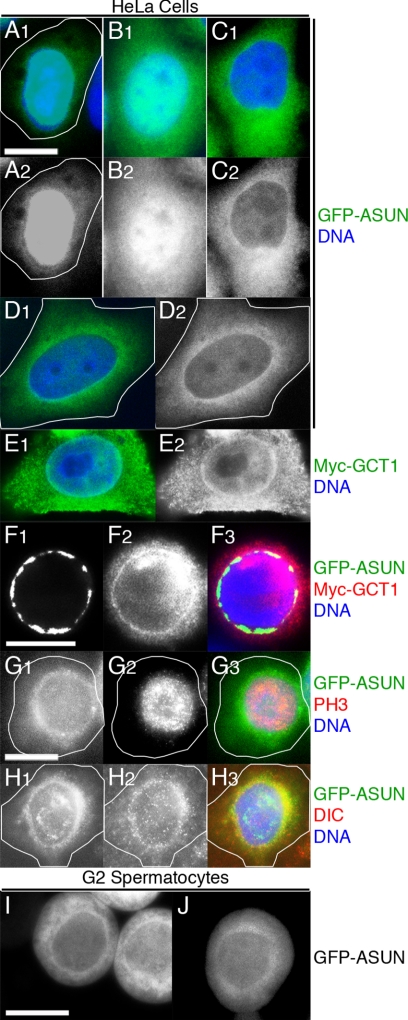
Figure 10.
Perinuclear localization of ASUN. (A–H) Fluorescence microscopy of transfected HeLa cells. DNA is in blue. (A–D) Localization of GFP-ASUN (green in A1–D1; grayscale in A2–D2) ranges from predominantly nuclear (A), distributed between the nucleus and cytoplasm (B), and predominantly cytoplasmic (C) with perinuclear enrichment (D) frequently observed. (E) Perinuclear enrichment of Myc-GCT1, the human homolog of ASUN (green in E1; grayscale in E2). (F) Colocalization of GFP-ASUN (F1; green in merge) and Myc-GCT1 (F2; red in merge) at the nuclear surface (F3; merge). (G and H) Nocodazole-treated cells expressing GFP-ASUN. (G) In prophase cells identified by phospho-histone H3 staining (G2; red in merge), GFP-ASUN (G1; green in merge) displayed a perinuclear localization (G3; merge). (H) Colocalization of GFP-ASUN (H1; green in merge) and dynein IC (H2, red in merge) in cells exhibiting perinuclear dynein localization (H3; merge). (I and J) Perinuclear localization of GFP-ASUN is occasionally observed in late G2 spermatocytes of a Drosophila transgenic line with relatively low expression. Bars, 10 μm.

