Figure 9.
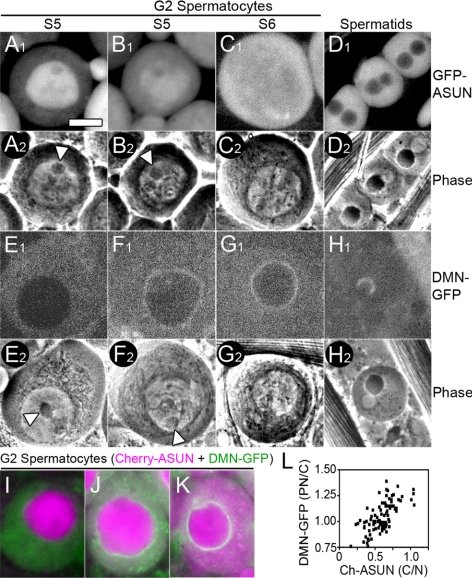
Coincident localization changes of ASUN and dynactin in primary spermatocytes. (A–D) Matched fluorescent (A1–D1) and phase contrast (A2–D2) images of representative G2 spermatocytes (A–C) and onion-stage spermatids (D) expressing GFP-ASUN. (A and B) In S5 spermatocytes, GFP-ASUN is largely nuclear (A) or in both nucleus and cytoplasm (B). Arrowheads mark intact nucleoli characteristic of this stage. (C) S6 spermatocyte with uniformly distributed GFP-ASUN. (D) GFP-ASUN is excluded from spermatid nuclei. (E–H) Matched fluorescent (E1–H1) and phase-contrast (E2–H2) images of G2 spermatocytes (E–G) and onion-stage spermatids (H) expressing DMN-GFP. (E and F) S5 spermatocytes with DMN-GFP uniformly distributed in cytoplasm (E) or at nuclear surface (F). Arrowheads mark intact nucleoli characteristic of this stage. (G) S6 spermatocyte in which DMN-GFP has accumulated at the nuclear periphery. (H) DMN-GFP is localized to a hemispherical cap on the nucleus of spermatids. (I–K) Fluorescent images of representative G2 spermatocytes coexpressing Cherry-ASUN (magenta) and DMN-GFP (green). (I) Evenly distributed cytoplasmic DMN-GFP with minimal cytoplasmic Cherry-ASUN. (J) Low levels of perinuclear DMN-GFP with increased cytoplasmic Cherry-ASUN. (K) High levels of perinuclear DMN-GFP with Cherry-ASUN uniformly distributed between nucleus and cytoplasm. Bar, 10 μm. (L) Scatter plot displaying the relationship between release of Cherry-ASUN from the nucleus and accumulation of DMN-GFP at the nuclear periphery in late G2 primary spermatocytes. Each data point represents a single spermatocyte for which the ratio of the intensity of peripheral nuclear to cytoplasmic DMN-GFP signal is plotted against the ratio of the intensity of cytoplasmic to nuclear Cherry-ASUN signal.

