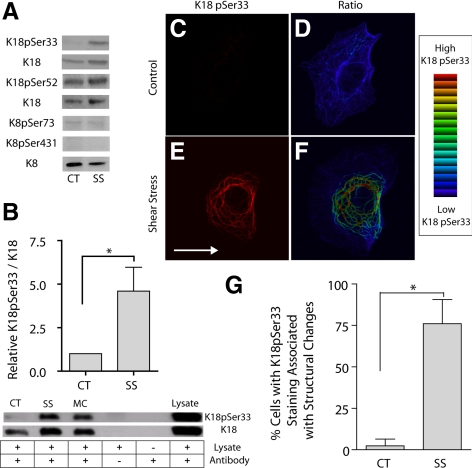
Figure 3.
Shear stress causes an increase in K18pSer33 phosphorylation. A549 cells were subjected to shear stress (30 dyn/cm2; 60 min; SS) and compared with static controls (CT). (A) Keratin 18 was immunoprecipitated by dilution of whole cell extracts with 1% NP-40 buffer using a polyclonal anti-K18 and recovered with protein A/G Sepharose. Proteins were separated on 10% SDS-PAGE, transferred to nitrocellulose, and immunoblotted with phospho-specific antibodies to K18pSer52, K18pSer33, K8pSer73, and K8pSer431 along with K18 or K8 antibody as loading control. (B) Equal amounts of protein from cell lysates were separated by 10% SDS-PAGE, transferred to nitrocellulose, and immunoblotted with phospho-specific antibodies to anti-K18pSer33 and anti-K18 antibodies. Microcystin (MC) was used as a positive control for K18pSer33 phosphorylation. Graph represents relative intensity of K18pSer33 to K18 (mean ± SD, n = 8, p < 0.01). (C–F) Cells were fixed and processed with anti-K18 and anti-K18pSer33 antibodies for indirect immunofluorescence; representative confocal micrographs show immunolocalization of K18pSer33 (C and E). Ratio imaging was used to assess relative levels of K18Ser33 phosphorylation to K18; blue indicates low levels and red indicates high levels of K18pSer33 phosphorylation using an intensity-modulated display (D and F). (G) Percentage of cells with K18pSer33 staining associated with keratin tonofibril bundles under static control and shear stress conditions (mean ± SD, ∼750 cells each from three separate experiments counted by two different blinded individuals).

