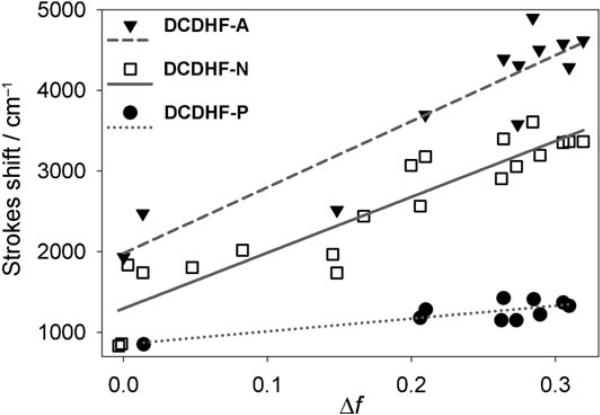
Figure 2.
Solvatochromism exhibited in a Lippert–Mataga plot (see text for details). The slopes of the fits for DCDHF-A, DCDHF-N, and DCDHF-P (structures in Figure 3) are 7757, 6921, and 1588 cm−1, respectively; these slopes correspond to the change in dipole (μE–μG) values of 9.7, 9.4, and 4.4 D. As expected, increasing the conjugation length between the donor and acceptor increases the sensitivity to solvent polarity, because photoinduced charge transfer across a greater distance results in a larger change in the dipole moment. (Data from refs. [15] and [20].)

