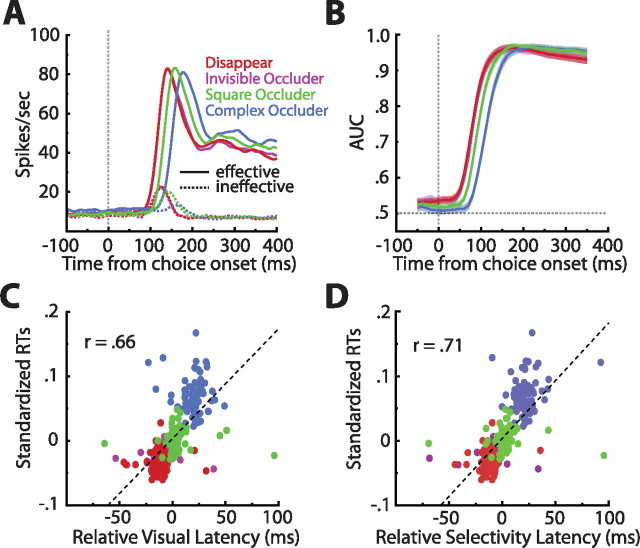
Figure 6.
Analysis of choice epoch responses. A, Population averaged spike density functions sorted by image effectiveness and condition. Note the temporal staggering of the responses reflecting the forward masking effect from the square and complex occluders. B, Population averaged sliding window ROC analyses sorted by condition (step, 10 ms; window, 100 ms). Shaded regions indicate ±1 SEM. The graph confirms the high discriminability of the responses elicited by the effective and ineffective stimuli. C, Scatter plot of the visual latencies of individual cells and the monkey's average standardized reaction times (RTs). Observe the highly significant correlation between the two measures. D, Scatter plot of the selectivity latencies of individual cells and the monkey's average standardized reaction times. Note that the relationship is even stronger than between visual latency and reaction times. In both scatter plots, the colors indicate from which condition the points came and the line is the best least-squares fit to the data.

