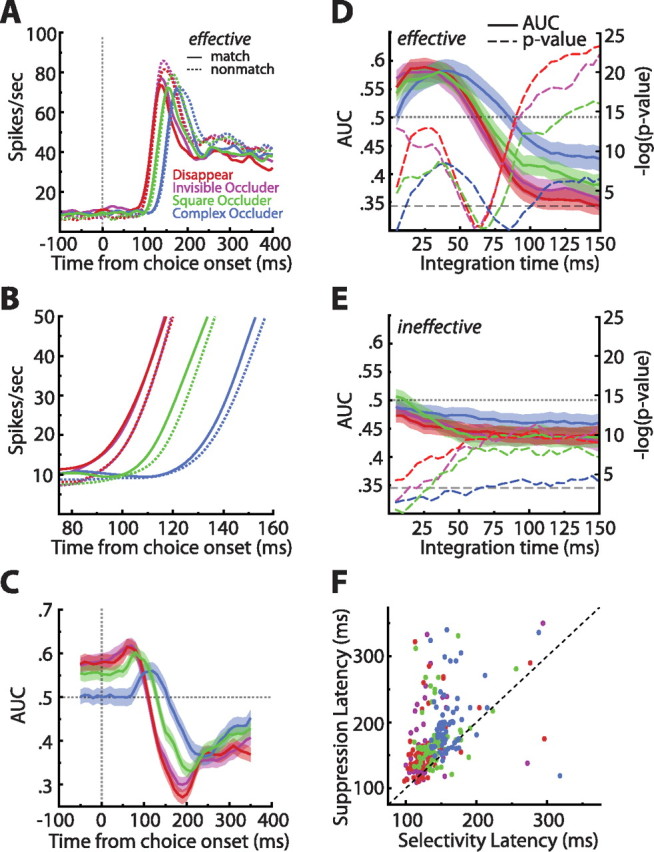
Figure 7.

Single-cell match enhancement and suppression effects. A, Population averaged spike density functions sorted by match status and condition, restricted to the effective stimulus. Note the large but delayed match suppression in all conditions. B, Zoomed in view of the spike density functions sorted by match status and condition. This plot reveals a small but reliable match enhancement in all conditions. C, Sliding window ROC analyses comparing match with nonmatch responses (step, 10 ms; window, 100 ms). Values above 0.5 indicate enhancement, whereas values below 0.5 indicate suppression. Shaded regions indicate ±1 SEM. The analysis confirmed an early match enhancement effect that was succeeded by match suppression. D, Match enhancement and suppression as a function of counting window. Shaded regions indicate ±1 SEM. In all conditions, we see a reliable match enhancement that is obscured by match suppression if the integration time is allowed to be long enough. The −log(p value) of Wilcoxon's signed ranks tests done on all data points indicate that indeed both enhancement and suppression were significant [the bottom dashed line indicates −log(0.05)] (for more details, see Results). E, The match enhancement was stimulus specific, because repeating the same analysis outlined in D on the ineffective stimulus yielded only match suppression. F, Scatter plot of match suppression latencies as a function of visual latencies. The dashed line is what would be expected if selectivity and suppression arose simultaneously. Match suppression is unlikely to be purely bottom up because, on average, it was delayed by 35 ms relative to the first sign of visual selectivity (p ≪ 0.0001). Colors denote from which conditions the points came.
