
Figure 8.
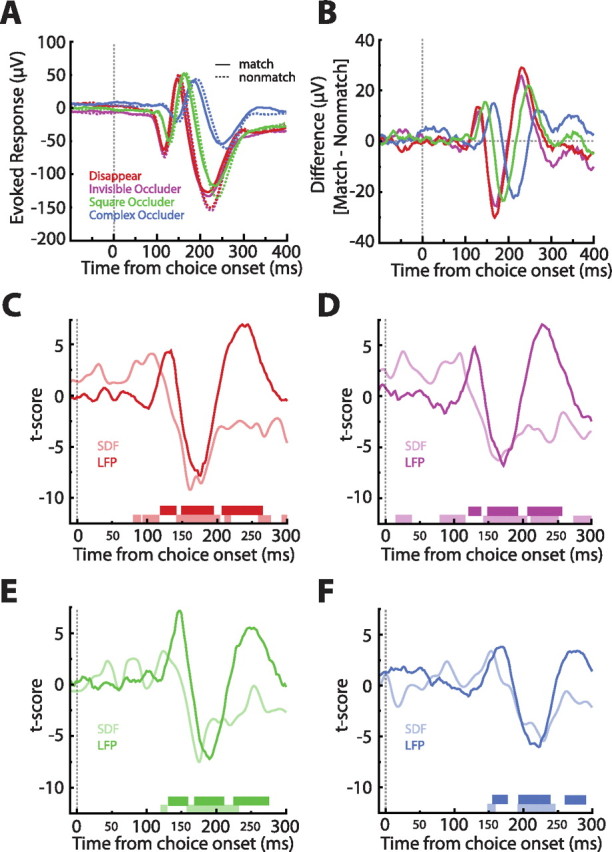
LFP match effects and their relation to spike match effects. A, Raw LFP waveforms averaged across all stimuli and sessions and sorted by match status and condition. Note the small but reliable differences in the match/nonmatch waveforms. B, LFP difference waveforms (match − nonmatch). Notice the consistent differences across the four conditions. C–F, t-transformed LFP differences (dark lines) and SDF differences (light lines). The times at which the LFP or SDF differences became significant is indicated by the dark or light bars, respectively, at the bottom of the plots. Note that, in all cases, the very first significant match effect was present in the single-cell responses. Also, observe that the LFP differences seem to be lagging the SDF differences.