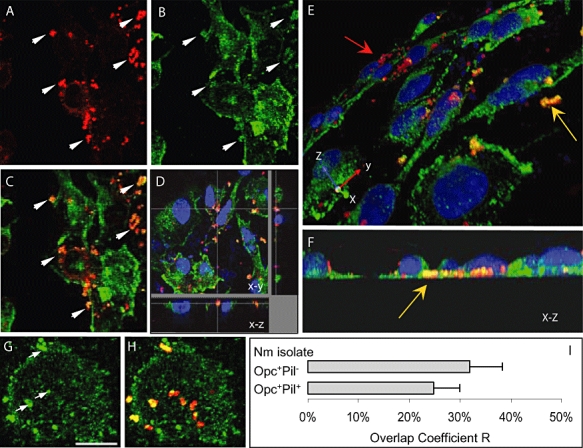
Fig. 5.

Confocal laser scanning microscopy to assess intracellular interactions of N. meningitidis with α-actinin. A–H. Confluent HBMEC monolayers grown on coverslips were infected with the Opc+Pil+ (A–F) or Opc+Pil− (G and H) Nm phenotypes in the presence of NHS. After 8 h, non-adherent bacteria were washed off, cells fixed with paraformaldehyde and permeabilized with 0.1% Triton X-100. Subsequently, bacteria and α-actinin were stained as described in Experimental procedures (α-actinin, green; bacteria, red). A–C. One field showing x–y images of Nm (A) or α-actinin (B) location. The overlay image in (C) indicates several regions in which yellow-orange colour appears suggesting colocalization. Arrows in (A) and (B) show regions where a high degree of α-actinin accumulation appears around bacteria. D. Optical dissection of an infected HBMEC monolayer indicating colocalization around intracellular bacteria located at the base of a cell. Again, this colocalization is not due to accidental proximity of α-actinin, as the general stain of α-actinin in this region is low. E and F. Three-dimensional images of infected HBMEC monolayers processed as above. An oblique view of the apical surface (E) shows adherent bacteria stained red (red arrow) whereas several bacteria located towards the basal surfaces of endothelial cells (yellow arrow) are distinctly orange/yellow in colour. Basal location can be more clearly seen in (F) which is an end-on X–Z cross-section. G and H. Accumulation of α-actinin (arrows in G) can also be seen clearly around infecting Opc+Pil− Nm. I. Using Volocity software, the overlap coefficient values, R, were obtained using data from more than five experiments as described in the text. No statistical difference in the values for R was observed between Opc+Pil+ or Opc+Pil− Nm. Bar in (G) represents 20 μm.
