Fig. 6.

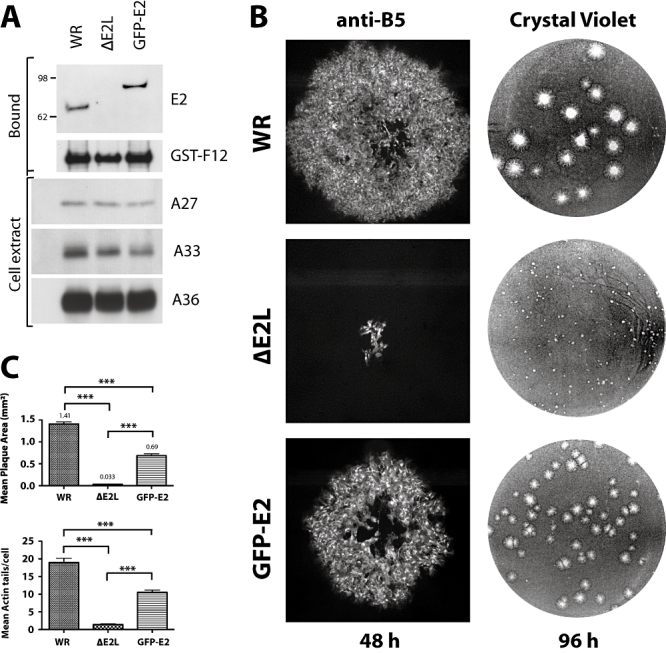
Loss of E2 leads to reduced actin tail formation and cell-to-cell spread. A. Immunoblot analysis of E2 expression in WR-, WR-ΔE2L- or WR-GFP-E2-infected HeLa cells at 10 h post infection. The E2 signal in the infected cell extracts was enriched using a GST-F12 pull-down as the protein is expressed at very low levels. The expression levels of A27, A33, A36 in the infected cell extracts used for the GST-F12 pull-down are provided as loading controls. B. Representative images of plaques formed by WR, ΔE2L and WR-GFP-E2 in confluent BS- C-1 monolayers at 48 (anti-B5) and 96 h (crystal violet) post infection. C. Quantitative analysis of plaque size at 48 h post infection and the number of actin tails per cell in WR, ΔE2L and WR-GFP-E2 at 8 h post infection. Error bars representing the SEM were derived from measuring the area of 20 plaques or counting 150 infected HeLa cells. ***P < 0.001.
