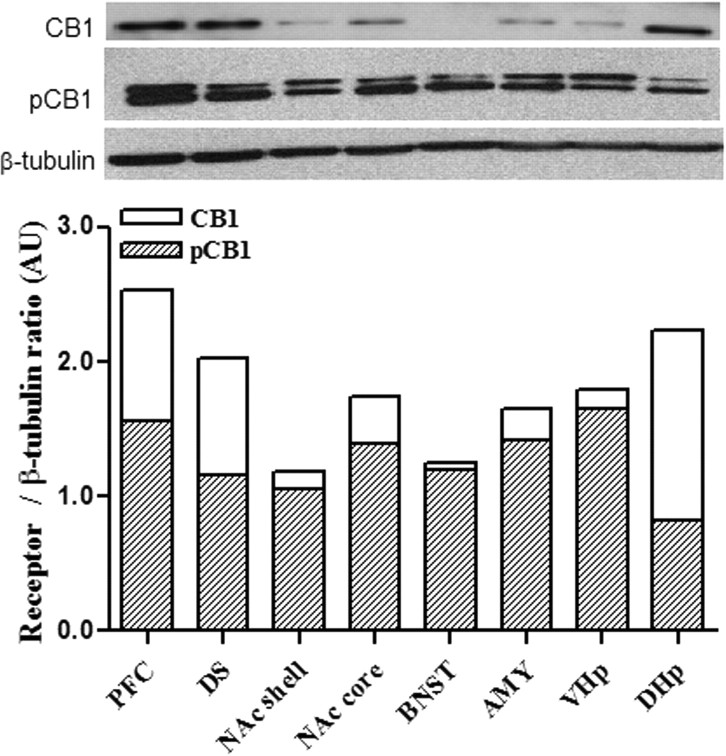
Figure 5.
Regional differences in total CB1 receptor and pCB1 protein expression in the brain. Top, Representative immunoblots for total CB1, pCB1 receptors, and the loading control β-tubulin show the pattern of functional CB1 receptor distribution throughout the brain. Bottom, The bar graph shows the quantification of the single band corresponding to CB1 receptor protein expression and the double band (see Materials and Methods) corresponding to pCB1 receptor immunoreactivity, both normalized by β-tubulin immunoreactivity. Data are expressed as receptor/β-tubulin immunoreactivity ratio. AU, Arbitrary units.

