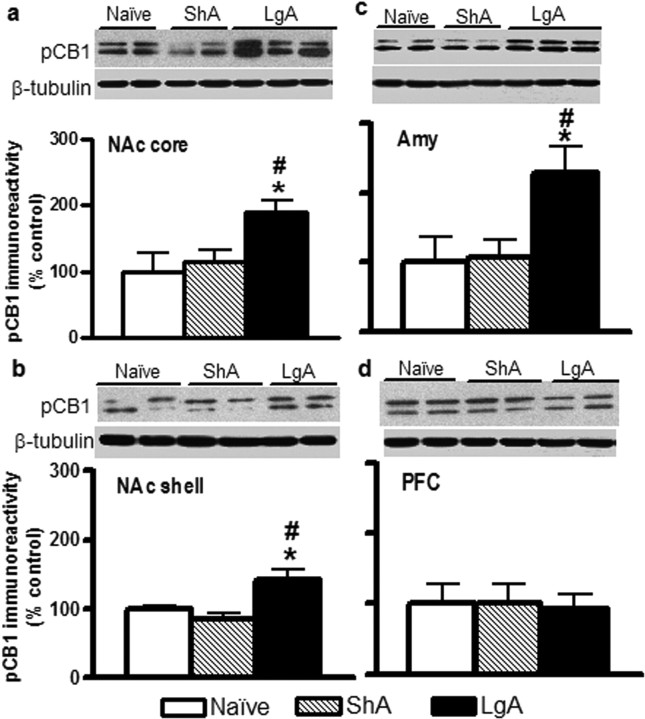
Figure 6.
Western blot analysis of pCB1 receptor immunoreactivities in NAc core, NAc shell, Amy, and PFC of drug-naive and cocaine ShA and LgA rats. Top panels show representative immunoblots for pCB1 and the loading control β-tubulin in nucleus accumbens core (a; NAc core), nucleus accumbens shell (b; NAc shell), Amy (c), and PFC (d). Bar graphs show the quantification of pCB1 receptors immunoreactivity (double-band quantification; see Materials and Methods). Data in graphs are represented as mean ± SEM (n = 4–5) and expressed as percentage values of the drug-naive rats for each group in every brain structure after normalization by β-tubulin. Animals were killed 24 h after the last cocaine session. LgA, Long access to cocaine (filled bars); ShA, short access to cocaine (striped bars); Naïve, drug-naive rats (open bars). Different from drug-naive rats, *p < 0.05; different from ShA rats, #p < 0.05. β-Tubulin expression was constant across the groups (p > 0.05, n.s.).

