
Figure 3. Flow cytometry of B cells in R4A × FcγRIIB-/- BALB/c mice.
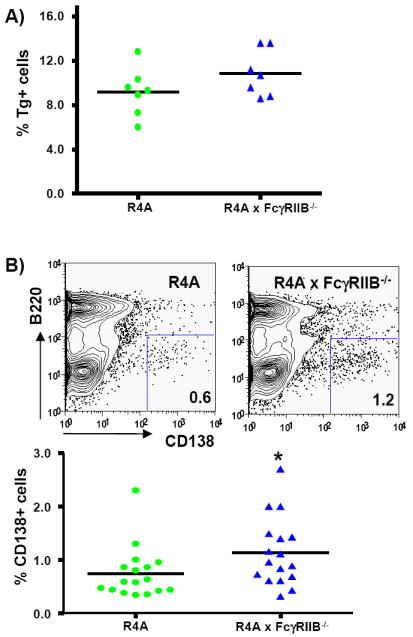
A) Splenocytes from 5 to 10 month-old R4A mice (n = 7) and R4A × FcγRIIB-/- mice (n = 7) mice were analyzed for the percentage of Tg+ B cells using an anti-IgG2b antibody. Analysis of B220+/Tg+ cells revealed no difference by Mann-Whitney in this study, and the analysis of a second set of mice. B) Splenocytes from R4A mice (n = 17) and R4A × FcγRIIB-/- mice (n = 17) were stained with B220 and CD138 to determine the percentage of B220lo/CD138+ plasma cells. Representative contour plots from each mouse are shown. The percentage of B220lo/CD138+ cells were significantly increased in R4A × FcγRIIB-/- mice (*p < 0.04 determined by Mann-Whitney). Data are shown as the mean ± SD.