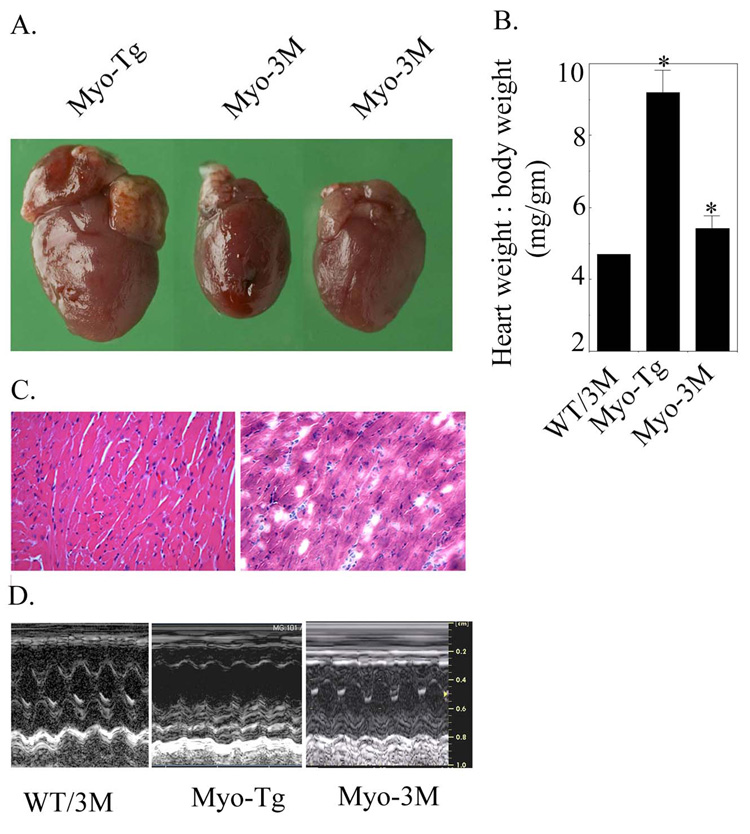
Figure 1. Attenuation of cardiac hypertrophy in Myo-3M mouse.
(A) Typical appearance of heart size in Myo-Tg and Myo-3M mice. (B) Heart weight: body weight ratio in Myo-3M mice. Values represent mean ± SE and p = 0.002 compared with untreated Myo-Tg mice (n=6). (C) H &E staining of Myo-Tg and Myo-3M mice hearts. Sections were visualized and photographed with an Olympus photomicroscope at 20 × magnification. (D) Representative M-mode tracings of the left ventricle obtained in WT/3M, Myo-Tg and Myo-3M mice. Results are presented as the mean SEM and represent four different mice (p < 0.001 compared with the Myo-Tg mice).

