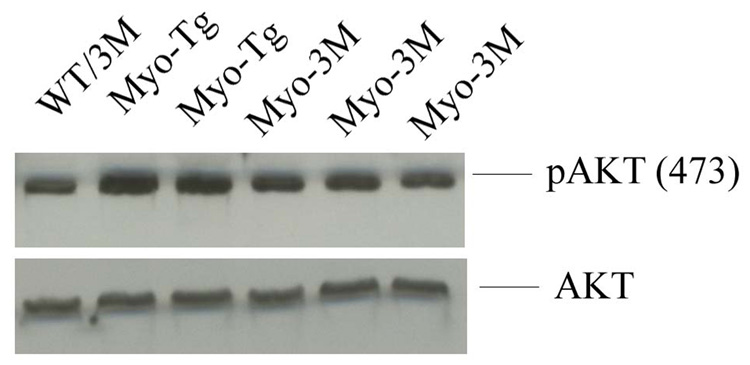
Figure 7. Analysis of Akt phosphorylation in Myo-3M mice hearts.
Total protein extracts were made from both WT/3M, Myo-Tg and Myo-3M mouse hearts. 50 µg of protein extracts were run on 10 % SDS-PAGE and were probed with pAkt (473) and Akt. Results are presented as the mean SEM and represent three different mice (p < 0.001 compared with the Myo-Tg mice).

