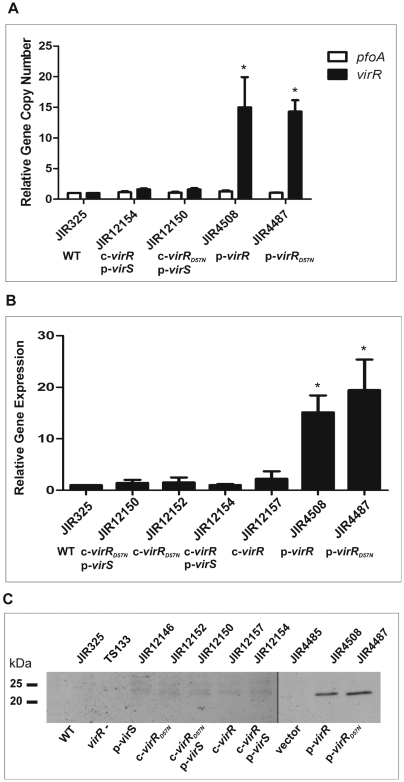
Figure 4. Determination of virR copy number, virR expression levels and VirR levels in C. perfringens.
(A) Determination of virR copy number. Genomic DNA from each strain was isolated from three biological replicates and assayed in triplicate by QRT-PCR. The gene copy number of virR (black bars) and pfoA (white bars) in each strain relative to the wild-type (WT) copy number normalised to the rpoA gene is shown. The strains are indicated below each set of bars, and the chromosomal (c) or plasmid (p) location of the virR, virRD57N and/or virS genes is shown beneath each strain. (B) Determination of virR expression using QRT-PCR. Total RNA from each strain was isolated from three biological replicates and assayed in triplicate. The expression levels of virR (black bars) in each strain relative to WT levels normalised to the rpoA gene (relative gene expression) are shown. The strains are indicated as for (A). In (A) and (B), the error bars represent the standard error of the mean, and the asterisks (*) represent a P-value of<0.05 calculated by two-tailed Student's t-test. (C) Immunoblot analysis of wild-type and TS133 derivatives. Western blots were carried out on whole cell extracts of the strains indicated above each lane. A brief description of each strain is given below the blot. The blots were probed with polyclonal rabbit VirR antiserum, followed by chemiluminescent detection. Molecular size markers (kDa) are as indicated.

