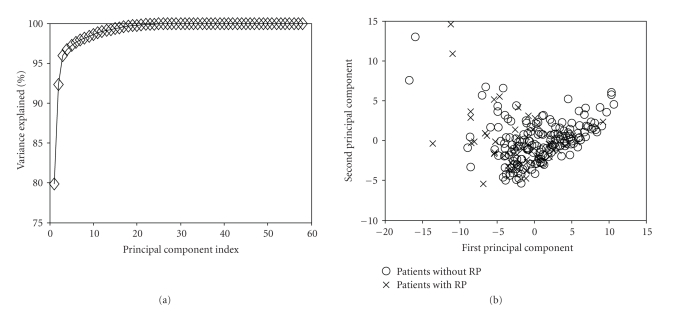
Figure 8.
Visualization of the 58 variables related to RP by PCA. (a) Variation explanation versus principle component (PC) index. This represents the variance of the data model about the mean prognostic input factor values. (b) Data projection into the first two components space. Note the high overlap in projection space, which suggests nonlinear kernel modeling to achieve better predictive power.

