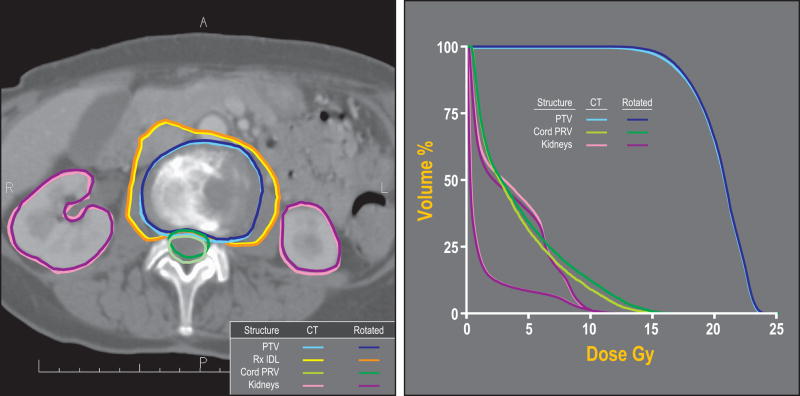
Figure 2.
(a) Planned and actual position of target and normal structures relative to the prescription dose surface in a single fraction treatment (14 Gy prescribed to the 63% isodose line). This case, which had minor rotational setup errors (0.92, 1.57, and −0.77 degrees) but close proximity of the PTV and PRV, showed the largest difference between the planned and estimated delivered D10 to the PRV (0.9 Gy).
Shown are the planned PTV (light blue), planned PRV (light green), and the kidneys (pink). Rotation-corrected PTV, PRV and kidneys are shown in dark blue, dark green and purple, respectively. The planned and rotated 14 Gy isodose lines are shown in yellow and orange, respectively (b) Dose-volume histogram of the original plan and the actual delivered treatment.

