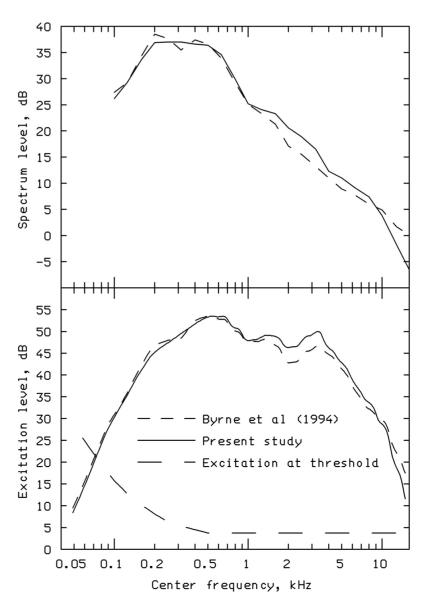
Fig. 1.
The upper panel shows the composite speech spectrum (average for the male and female talkers) determined at Cambridge (solid line), and the composite speech spectrum reported by Byrne, et al. (1994) (dashed line). In both cases, the spectrum level (re 20 μPa) is plotted against center frequency, and the overall level was adjusted to be 65 dB SPL. The lower panel shows excitation patterns calculated from these spectra, together with the excitation level required for threshold.

