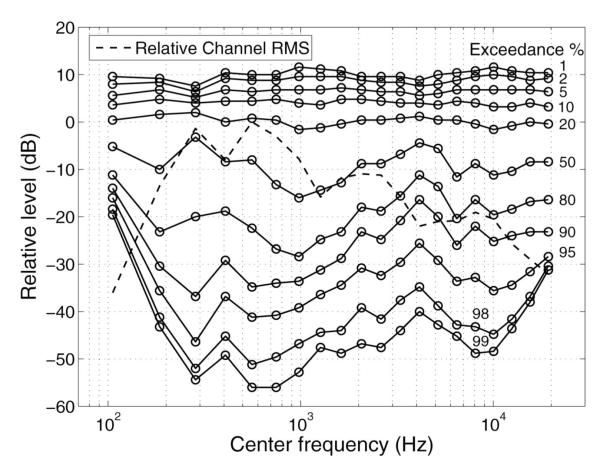
Fig. 2.
Distribution of levels for a typical female talker recorded at Cambridge. The abscissa shows the center frequency of the 2-ERBN-wide analysis band. The ordinate shows relative level in dB. The dashed line shows the relative root-mean-square (RMS) level in each band, scaled so that the level of the band with the highest level is set to 0 dB. This line indicates the spectral shape of the speech for that specific talker. The solid lines with circles show “equal-exceedance contours” (EECs); see text for details.

