
Figure 2. Exonuclease Activities of RecE Proteins.
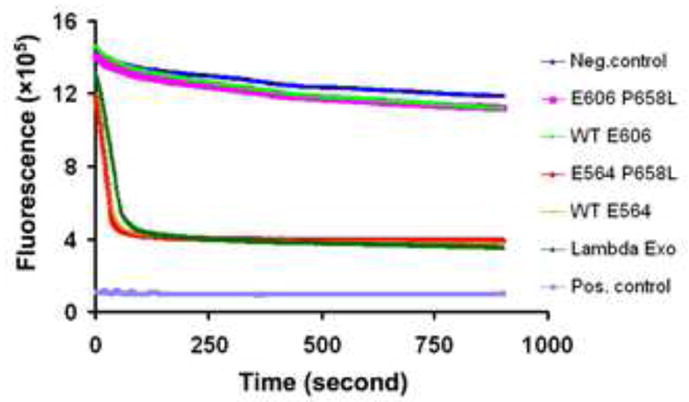
The plot shows the decrease in fluorescence of PicoGreen due to the digestion of a linear 2.7 KB dsDNA fragment upon addition of exonuclease enzyme. The different curves are for reactions with different exonuclease enzymes, as indicated at right. The upper blue curve is the negative control, measured from a reaction with storage buffer substituted for exonuclease enzyme. The positive control (lowest curve) shows the fluorescence of the heat-denatured 2.7 KB dsDNA fragment at ½ concentration to mimic the low signal of the ssDNA product. Notice that the exonuclease activity of RecE564 is similar to that of λ exonuclease, and much higher than that of RecE606. The P658L mutation, which dramatically improves the crystals of the RecE606 protein, has essentially no effect on the exonuclease activity of either RecE564 or RecE606.