
Figure 6. View of the Central Channel and Active Site Tunnels in the RecE Tetramer.
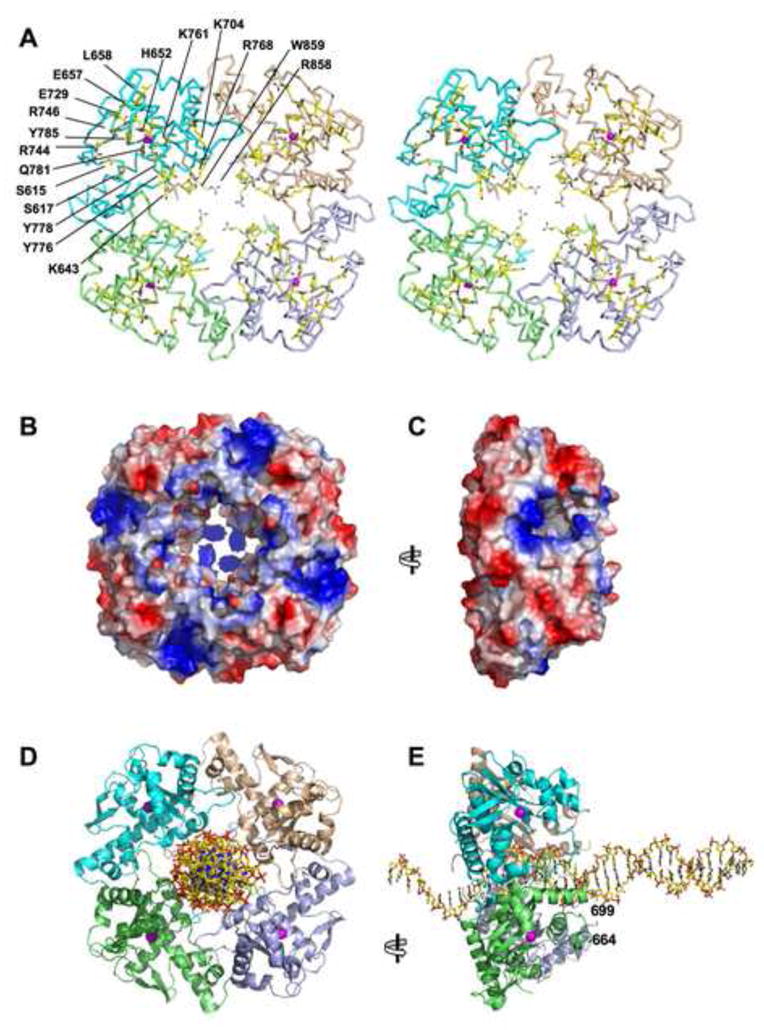
(A) Stereo Cα trace of the RecE tetramer with individual subunits colored as in Figure 5. Side chains lining the central channel and the active site tunnels are highlighted in stick form with carbon yellow, oxygen red, and nitrogen blue. The rear of the central channel is plugged by the C-terminal segment of each subunit, which includes Arg-858 and Trp-859. Side chains of Lys-704 and Lys-643 are not included in the final refined model, but are shown here to indicate their positions on the backbone.
(B) Surface view of the RecE tetramer colored according to electrostatic potential, with blue strongly positive and red strongly negative based on a charge-smoothed potential calculated in PYMOL (Delano Scientific LLC). Notice the weakly positive electrostatic potential of the central channel, except at the back where Arg-858 gives it a strong positive potential. Side chains of residues 637–646, 700–701, and 704 are not included in the final model, but are included here to indicate their presence on the surface.
(C) View from the left of panel B, looking into the active site portal of the upper, front subunit. Notice the strong positive electrostatic potential around the rim of the active site portal.
(D) View of the RecE tetramer with B form DNA modeled manually into the central channel.
(E) Side view of the model for the RecE-DNA complex, with dsDNA entering the central channel at right, and ssDNA exiting the channel at left. Residues flanking the disordered loop of the green subunit are indicated by the numbers. Notice that this loop and the equivalent loops of the other three subunits are in position to interact with the downstream portion of the incoming DNA substrate.