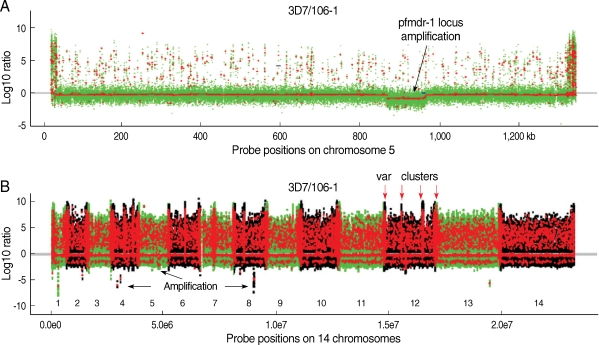
Fig. 2.
Chromosome segmentation analysis showing genomic amplification and deletion/highly polymorphic regions on chromosomes of Plasmodium falciparum. Signals from DNA hybridizations to the Sanger tiling microarray were normalized as described [53]. Chromosomal segments (seen as dots) from circular binary segmentation (CBS) analysis [91] of the data for 106/1 strain using 3D7 strain as reference were plotted. (A) Probe signal ratios (3D7 over 106/1) showing an amplification of a locus containing pfmdr-1 on chromosome 5 in the 106/1 parasite. Green dots are normalized log ratios of individual probe, and the red lines/dots are the mean values of normalized log ratios of all the probes in segments obtained after CBS analysis. Dots above the grey/red line at zero are polymorphic individual probes (green) or segments with multi-probes with similar reduced signals in 106/1 (red); and those under the line are potentially amplified regions (red). (B) CBS analysis applied to all chromosomes (1-14) of the 106/1 parasite using 3D7 as reference. The green dots are normalized log ratios of individual probes; and the red lines/dots are the mean values of normalized log ratios from all the probes in segments obtained after CBS analysis. The dots with positive values suggested polymorphisms between 106/1 and 3D7; and those with negative values were potential genomic amplification. Highly polymorphic chromosome ends and internal var gene clusters can be seen as intense red 'zones'. Red arrows point to 4 known var clusters on chromosome 12; and black arrows indicate some potential amplifications on chromosome 4, 5, and 8. The numbers 1-14 marks the parasite 14 chromosomes.

